Factsheet
Companies
Ventures
Corticeira Amorim
Tracing its roots back to the 19th century, Amorim has become the world’s largest cork and cork-derived company in the world, generating annualy more than 860 million euros in sales to more than 100 countries through a network of dozens of fully owned subsidiaries.
With a multi-million Euro R&D investment per year, Amorim has applied its specialist knowledge to this centuries-old traditional culture, developing a vast portfolio of 100% sustainable products that are used by blue-chip clients in industries as diverse and demanding as wines and spirits, aerospace, automotive, construction, sports, interior and fashion design.
Amorim’s responsible approach to raw materials and sustainable production illustrates the remarkable interdependence between industry and a vital ecosystem - one of the world’s most balanced examples of social, economic and environmental development.
Business Units
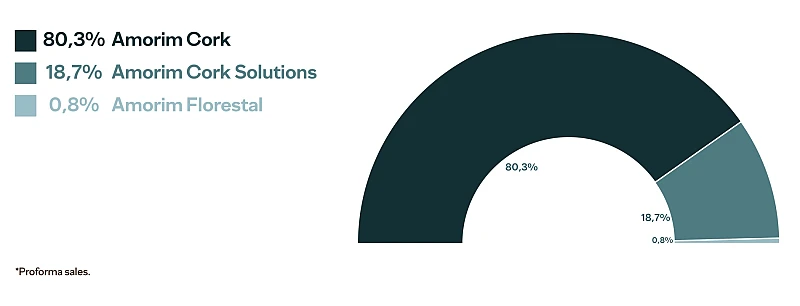
Sales by Business Unit (2025)
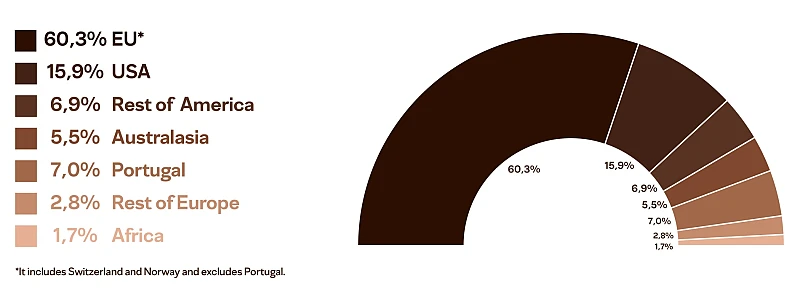
Sales by Geographical Area (2025)
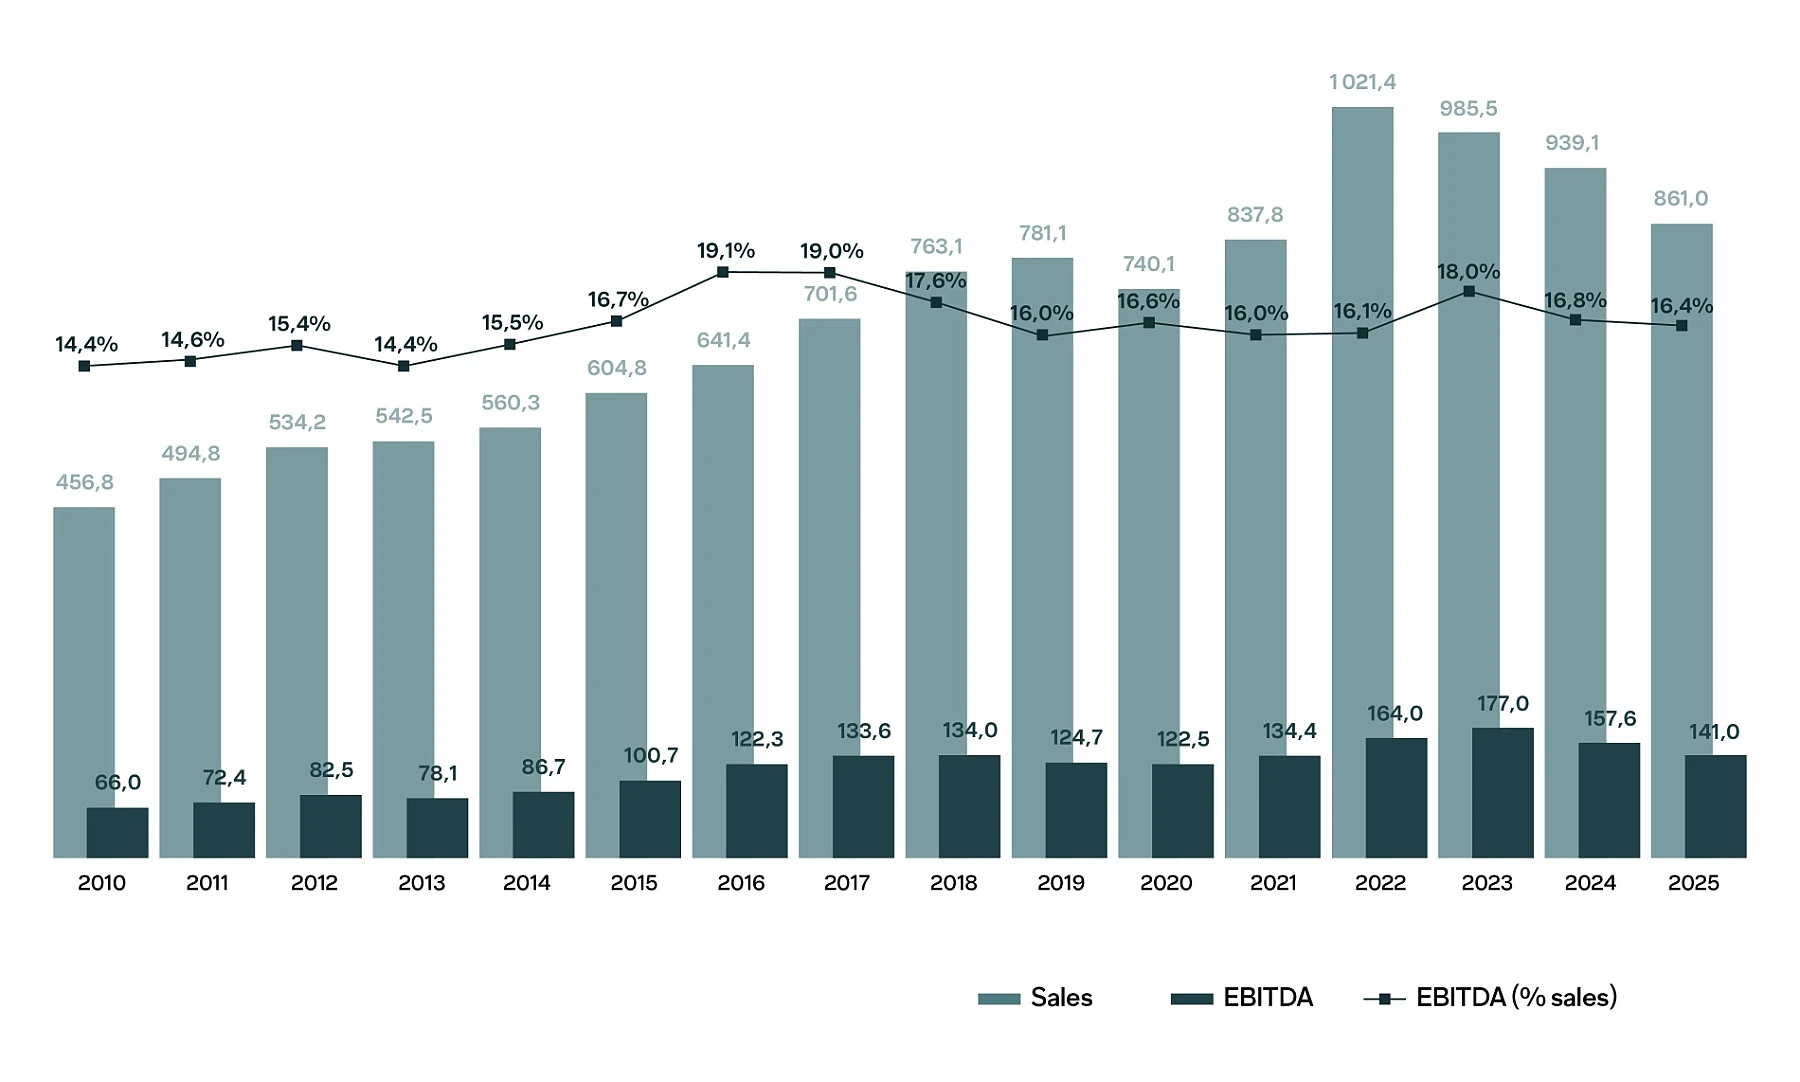
Sales| EBITDA | Margin EBITDA / Sales (2025)
Key Figures
| Income Statement | Unit | 2025 | 2024 | 2023 | 2022 | 2021 |
|---|---|---|---|---|---|---|
| Sales | M€ | 861,0 | 939,1 | 985,5 | 1021,4 | 837,8 |
| Gross Margin | M€ | 470,4 | 496,3 | 507,6 | 523,8 | 415,8 |
| Gross Margin / Sales | % | 54,6 | 52,8 | 51,5 | 51,3 | 49,6 |
| External Supplies | M€ | 140,5 | 151,5 | 151,2 | 186,5 | 142,6 |
| Staff Costs | M€ | 190,7 | 193,2 | 189,7 | 182,9 | 146,1 |
| Other Operating Costs (includes depreciation) | M€ | 57,0 | 51,6 | 41,7 | 39,0 | 33,5 |
| EBITDA | M€ | 141,0 | 157,6 | 177,0 | 164,0 | 134,4 |
| EBITDA / Sales | % | 16,4 | 16,8 | 18,0 | 16,1 | 16,0 |
| EBIT | M€ | 82,1 | 99,9 | 125,1 | 115,3 | 93,7 |
| Net Income | M€ | 55,6 | 69,7 | 88,9 | 98,4 | 74,8 |
| Consolidated Statment of Financial Position | Unit | 2025 | 2024 | 2023 | 2022 | 2021 |
|---|---|---|---|---|---|---|
| Net Goodwill | M€ | 29,1 | 29,2 | 23,9 | 18,9 | 9,8 |
| Net Fixed Assets / Intangible Assets / Rights of Use | M€ | 440,5 | 460,9 | 467,4 | 420,1 | 307,4 |
| Net Working Capital * | M€ | 435,0 | 529,8 | 555,4 | 441,8 | 358,3 |
| Other ** | M€ | 48,1 | 44,3 | 43,0 | 46,2 | 61,3 |
| Invested Capital | M€ | 952,7 | 1064,1 | 1089,6 | 926,9 | 736,8 |
| Net Debt | M€ | 75,9 | 195,7 | 240,8 | 129,0 | 48,07 |
| Share Capital | M€ | 133,0 | 133,0 | 133,0 | 133,0 | 133,0 |
| Reserves and Retained Earnings | M€ | 618,1 | 611,3 | 577,2 | 532,6 | 462,9 |
| Non Controlling Interests | M€ | 89,2 | 90,8 | 89,8 | 79,3 | 27,3 |
| Agreement to Acquire Non-controlling Interests | M€ | 0,0 | 0,0 | 0,0 | 0,0 | 5,0 |
| Taxes and Deferred Taxes | M€ | 13,5 | 5,6 | 19,6 | 25,1 | 33,3 |
| Provisions | M€ | 7,4 | 8,9 | 11,1 | 6,6 | 5,5 |
| Grants *** | M€ | 15,7 | 17,9 | 18,0 | 21,3 | 21,7 |
| Equity and Other Sources | M€ | 876,8 | 867,5 | 848,8 | 767,9 | 688,8 |
* Inventories + Accounts receivables - Accounts payables + Other operating assets/(liabilities)
** Investment property + Investments in associates + Intangible assets + Other non-operating assets/(liabilities)
*** Non interest bearing grants (reimbursable and non-reimbursable)
| Data per share | Unit | 2025 | 2024 | 2023 | 2022 | 2021 |
|---|---|---|---|---|---|---|
| Number of shares | shares | 133.000.000 | 133.000.000 | 133.000.000 | 133.000.000 | 133.000.000 |
| Earnings per share | € | 0,418 | 0,524 | 0,668 | 0,740 | 0,562 |
| Book value per share | € | 6,318 | 6,279 | 6,015 | 5,601 | 4,686 |
| Share price (period-end) | € | 6,610 | 8,050 | 9,140 | 8,720 | 11,28 |
| Market Capitalisation (period-end) | M€ | 879,0 | 1070,7 | 1215,6 | 1.159,8 | 1.500,2 |
| Dívida & Rácios | Unit | 2025 | 2024 | 2023 | 2022 | 2021 |
|---|---|---|---|---|---|---|
| Net Debt | M€ | 75,9 | 195,7 | 240.8 | 129,0 | 48,07 |
| Net Debt/EBITDA | X | 0,54 | 1,24 | 1,36 | 0,79 | 0,36 |
| EBITDA/Net Interest | X | 86,7 | 45,0 | 52,6 | 148,6 | 167,7 |
| Gearing | % | 9,0 | 23,4 | 30,1 | 17,3 | 7,7 |
| Net Working Capital (NWC) | M€ | 435,0 | 529,8 | 555,4 | 441,8 | 358,3 |
| NWC / Market Capitalization | % | 49,5 | 49,5 | 45,7 | 38,1 | 26,4 |
| NWC / Sales x 360 | X | 181,7 | 203,1 | 202,9 | 109,3 | 154,0 |
| Free Cash Flow (FCF) | M€ | 175,9 | 109,5 | -45,1 | -139,6 | 119,2 |
| Capex | M€ | 42,8 | 43,0 | 95,3 | 76,7 | 44,0 |
| Return on Invested Capital (ROIC) | % | 6,4 | 10,2 | 10,0 | 11,8 | 10,2 |
| Average cost of debt | % | 2,6 | 3,7 | 3,1 | 1,2 | 0,9 |
Net Debt/EBITDA considering the EBITDA of the last four quarters
NWC = Inventories + Trade receivables + Other operating assets - Trade payables - Other operating liabilities
FCF = EBITDA - Non-current cash expenditures - Net financing expenses - Income tax - Capex - NWC variation
Analyst Coverage
| Entity | Analyst | Price-Target | Recommendation | Date |
|---|---|---|---|---|
| JB Capital Markets |
Luís Colaço
lcolaco@jbcapital.com
|
9,00 | Buy | 2026-07-23 |
| CaixaBank BPI |
Bruno Bessa
bruno.filipe.bessa@caixabankbpi.com
|
7,30 | Neutral | 2026-07-03 |
| Santander |
Manuel Lorente
manuel.lorente@gruposantander.com
|
7,12 | Underperform | 2026-06-12 |
| Caixa BI |
Carlos Jesus
carlos.jesus@caixabi.pt
|
8,90 | Buy | 2026-06-08 |
| Bestinver Securities |
Enrique Yáguez, CFA
eyaguez@bestinver.es
|
6,70-7,20 | Hold | 2026-04-27 |
| Berenberg |
Fraser Donlon
fraser.donlon@berenberg.com
|
9,00 | Buy | 2026-02-23 |
| A|S Independent Research |
António Seladas, CFA
aseladas@asindependentresearch.com
|
7,35 | Neutral | 2026-01-21 |
| ODDO BHF |
Luis de Toledo Heras
luis.de-toledo-heras@oddo-bhf.com
|
8,50 | Outperform | 2025-12-01 |
| Renta 4 |
Pablo Fernández de Mosteyrín
pablofernandez@renta4.es
|
8,60 | Hold | 2025-12-10 |